Michael Anderson
It is not possible to write a consistent history of the population of ‘East Lothian’ over the second half of the twentieth century, because both boundaries and how information was presented in published sources changed several times. The biggest disruption came with Local Government reorganisation in 1975. This added to the old county of East Lothian both the small burgh of Musselburgh and a part of its landward district, for which no previous population figures were published. Ending of regionalisation in 1996 left the new East Lothian’s boundaries unchanged, but there was no reversion to the pre-regionalisation detailed published figures which included separate data for parishes, for small burghs and for their surrounding landward areas. Significant urban boundary changes also occurred and even the ‘census population’ definition changed several times. What follows is thus often an approximate reconstruction – but some clear patterns and trends emerge.
Table 1: population present on census night including visitors
| Year | Old East Lothian | % change | New East Lothian | % change |
|---|---|---|---|---|
| 1931 | 47388 | |||
| 1951 | 52258 | 0.49 | 74000 | |
| 1961 | 52677 | 0.08 | 74829 | 0.11 |
| 1971 | 55906 | 0.60 | 77395 | 0.34 |
| 1981 | 59900 | 0.69 | 80666 | 0.41 |
| 1991 | 61843 | 0.32 | 83208 | 0.32 |
| 2001 | 66097 | 0.66 | 90088 | 0.80 |
Italicised figures are estimates. Figures are from the published censuses except for those for 2001, which are based on preliminary census figures kindly supplied by the East Lothian Council Planning Department but are not on exactly the same basis as for earlier years.
As Table 1 shows, Old East Lothian’s population was markedly higher in 1951 than in 1931, but some of this was due to temporary hospital and military residents who had left by 1961. Thereafter growth in Old East Lothian was steady to the end of the period, with the estimated 2000 population being about a quarter larger than that of 1951. By contrast, the population of Musselburgh actually fell between 1961 and 1981, thus retarding the estimated growth of what would become New East Lothian for the period as a whole.
However, this overall pattern of growth was the result of very contrasting local trends, as is shown in Table 2, where parishes are grouped to circumvent as far as possible boundary uncertainties post-regionalisation. The data for 1991 and 2001 are slightly rough estimates but inspection of the individual parish figures suggest that from the 1980s growth was widespread across the county, with growing numbers of families occupying houses even in quite remote areas from which they commuted to work elsewhere. Earlier, however, the hillfoot parishes had declined by 19% between 1951 and 2001, continuing a fall from a combined population of 4744 in 1901 and of 6553 in 1851. By contrast, the parishes in easy commuting distance from Edinburgh, and especially those served by train and frequent bus services, grew rapidly from the 1960s. The population of Gladsmuir including Longniddry more than doubling between 1961 and 1981, while Haddington’s numbers, boosted in part by the provision of some 250 new houses under a 1958 overspill agreement with Glasgow, rose by 54% between 1951 and 1981.
Table 2: population of groups of parishes, 1931-1997
| 1931 | 1951 | 1961 | 1971 | 1981 | 1991 | 2001 | |
|---|---|---|---|---|---|---|---|
| Hillfoot | 4170 | 3748 | 2726 | 2817 | 2883 | 2731 | 3033 |
| Coastal Plain | 5624 | 5574 | 5408 | 4900 | 5077 | 5706 | 6589 |
| Mining | 17020 | 20849 | 21984 | 22951 | 22637 | 22738 | 24836 |
| Holiday/Commuter | 14842 | 16356 | 15588 | 17451 | 20314 | 21278 | 21950 |
| Haddington | 5682 | 5731 | 6592 | 7787 | 8842 | 9490 | 9689 |
| Musselburgh/Inveresk | 20700 | 21493 | 22152 | 21489 | 20771 | 22243 | 23991 |
- Hillfoot parishes are Oldhamstocks, Innerwick, Saltoun, Stenton, Whittinghame, Garvald, Yester and Humbie
- Coastal Plain parishes are Prestonkirk, Morham, Bolton, Spott, Pencaitland, Athelstaneford and Whitekirk and Tyninghame
- Mining parishes are Prestonpans, Tranent and Ormiston
- Holiday/Commuter parishes are Gladsmuir, Aberlady, Dirleton, North Berwick and Dunbar
NB Coastal Plain and Commuter parish numbers are inflated for 1951 by several hundred hospital patients and military personnel and the Coastal Plain figures for 1981 are shown net of 147 ‘visitors”(believed to be Torness construction workers) temporarily present in Innerwick.
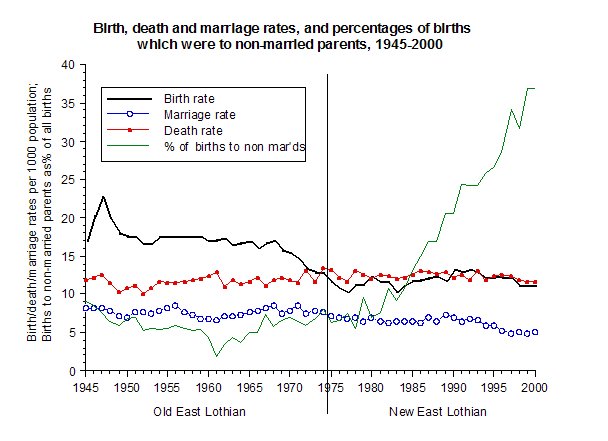
Population change is the net result of two sets of balances, births minus deaths (‘natural increase’) on the one hand, and in-migration minus out-migration on the other. As Figure 1 shows, while the death rate rose slightly over the period, reflecting a gradually aging population, the birth rate, after a peak following the Second World War, remained fairly stable until it began a dramatic ten-year fall in 1968 and only, at best, modestly recovered thereafter. The consequence of this was that in the last quarter of the century there were only six years when New East Lothian experienced positive natural increase with births exceeding deaths.
Figure 1
When these figures are combined with overall population change, it is clear that the years around 1970 saw a major change in the demographic fortunes of the county and of its constituent parts. Old East Lothian in the 1950s experienced net out-migration equivalent to about five percent of its 1951 population, and even in the 1960s in- and out-migrants were roughly in balance. Strong natural increase, however, just offset the net out-migration in the 1950s and produced most of the quite considerable population growth of the 1960s. In the 1970s and 1980s, by contrast, and almost certainly in the 1990s, natural increase tended to be negative, but strong in-migration produced continued steady population growth.
Within the county, however, there were significant contrasts, at least in the period up to 1971 (the only period for which data are available at this level), see Table 3.
Table 3
Population change and its components, percentage change per year, 1951-61 and 1961-71 for small burghs, East Lothian County, and its landward areas
| Natural increase | Net migration | Overall change | ||
|---|---|---|---|---|
| 1951-61 | Haddington S.B. | 0.39 | 1.64 | 2.03 |
| Dunbar S.B. | 0.36 | -0.87 | -0.51 | |
| North Berwick S.B. | -0.35 | 0.20 | -0.15 | |
| Tranent S.B. | 1.10 | -0.30 | 0.80 | |
| Prestonpans S.B. | 1.36 | -0.71 | 0.65 | |
| Landward areas | 0.70 | -1.16 | -0.46 | |
| Old East Lothian | 0.61 | -0.51 | 0.08 | |
| Musselburgh S.B. | 0.55 | -0.43 | 0.12 | |
| 1961-71 | Haddington S.B. | 0.77 | 0.94 | 1.71 |
| Dunbar S.B. | 0.37 | 1.09 | 1.46 | |
| North Berwick S.B. | -0.49 | 1.04 | 0.55 | |
| Tranent S.B. | 0.95 | -1.11 | -0.16 | |
| Prestonpans S.B. | 0.98 | -0.98 | 0.00 | |
| Landward areas | 0.55 | 0.03 | 0.58 | |
| Old East Lothian | 0.53 | 0.07 | 0.60 | |
| Musselburgh S.B. | 0.35 | -0.62 | -0.27 | |
The landward areas and the declining mining burghs of Prestonpans, Tranent and Musselburgh all experienced significant net out-migration in the 1950s and 1960s; in Tranent and Prestonpans in the 1960s this was the equivalent of nearly ten per cent of the 1961 population, but it was here almost totally offset by their continuing very high fertility (in many years well above 20 per 1000 population), a feature also of the 1940s and 1950s in these areas. By contrast, in both decades, there was large population inflow into Haddington, bolstering strong natural increase especially in the 1960s, which reflected the high fertility of the overspill population with its large numbers of young married couples. Of the burghs, only North Berwick in these two decades had negative natural increase, with death rates as high as 20 per 1000 reflecting its older population age structure, but net in-migration in the 1960s more than offset this producing growth of over five per cent for the decade.
The large numbers of in-migrants in this period were overwhelmingly white (a maximum of 0.7 per cent of the population was reported as non-white in 2001). Most had been born in Scotland (the percentage born in England and Wales rose only from 5.5% to 7.5% between 1951 and 1971). By far the largest source of in-migrants was the rest of Lothian Region, much of it linked to rising commuting to Edinburgh, with those moving into the county having a much more professional and middle class composition than either the resident population or movers within the county, who were more likely to have been in skilled manual occupations. One consequence of the outflows of the 1950s and 1960s was that the proportions born in East Lothian fell steadily. So too, presumably reflecting declining employment and aging populations in the mining districts, did the number of those born in Fife, West Lothian, Lanarkshire and Stirling.
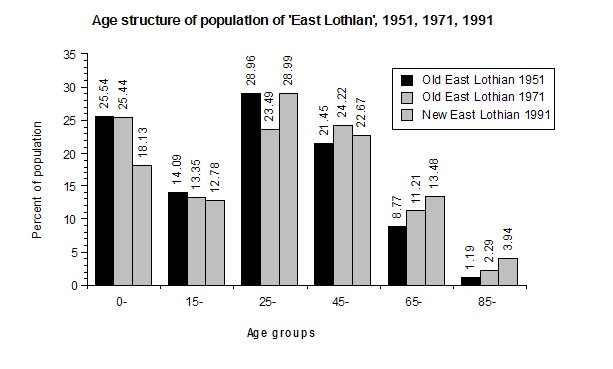
Figure 2 shows the changing age structure of the county as a whole. The rapidly declining birth rate of the period after 1968 markedly reduced the number of children of school age and younger. The outflow of young adults in the 1950s and 1960s produced a significant dip in the proportion of the population aged 25-44 between 1951 and 1971, but the in-migration of the following twenty years returned this group to almost exactly its 1951 proportion. But the largest single change, as elsewhere in Scotland, was the steady growth in the proportion of elderly people. Particularly dramatic, and with considerable implications for social service and other support, was the rise in the number of people of 80 and over. In Old East Lothian in 1951 there were just 264 men and 359 women aged 80 or over. In 2001 there were nearly 1800 men and women aged 85 and over and nearly 600 of 90 and over
Figure 2
Of those aged 90 and over in 1991, only 20 of the 330 women were still married, and just 16 of the 394 men, thus emphasising still further the support needs of the oldest sections of the population. For older women, the problem of widowhood was almost unchanged between 1951 and 1991 – indeed in 1991 44% of women aged 70-74 were widowed compared with 40% in 1951, reflecting the fact that male mortality chances in old age improved hardly at all for most of this period. By contrast, women’s expectation of life at older ages increased considerably over the period, and the percentage of 70-74 year old men who were widowers fell from 26% in 1951 to just 14% in 1991. At all ages, divorce rates also rose. The total number of divorced persons in Old East Lothian in 1951 (147) was in marked contrast with the 3304 in New East Lothian in 1991
Another marked shift over time was the variation in the age at marriage and the proportions, especially of women, who eventually married. In 1951, 79% of men aged 20-24 and 56% of women of this age were still single. By 1971, these figures had fallen to 61% and 39% respectively, but by 1991 they had risen again to 84% and 68%, figures not far short of the all-time recorded high of the 1930s. At the same time, however, reflecting the high marriage rates of the 1970s, just 5% of women aged 45-49 were unmarried in 1991, compared with 7% of this age group in 1971 and an exceptionally high figure of 17% in 1951, a result of the low marriage rates of the interwar period.
Macmerry Gala 1975 (Gordon Collection)
Declining marriage rates from the 1970s at younger ages were in turn reflected in two features that appear to be historically new to East Lothian’s demography. While high proportions of young women were pregnant on their wedding day in the later nineteenth century, both cohabitation and births out of wedlock remained rare. By contrast, as Figure 1 shows, the percentage of births to non-married parents, which reached a low point in the later 1960s, and remained low until about 1980, rose rapidly thereafter and was approaching two in five by the end of the century. Across Great Britain as a whole, this rise in out-of-wedlock births was to a great extent associated with rising rates of childbirth within stable cohabitations. Preliminary data from the 2001 census showed that by that date 8.5% of people aged 18 and over were cohabiting, compared with 55.8% who were married. From 1997 when data first become available, more than two thirds of all births to non-married parents were recorded in the names of two parents giving the same address, thus suggesting that most such births were to couples in stable, but not married, relationships.